ARNscopeDownload

When AWS breaks, see why in one window. Not fifteen console tabs.

See which Step Functions state failed with its logs beside it, check whether an ECS rollout landed, and query a private database through an SSM tunnel ARNscope opens itself — signed in with the AWS profiles you already use. Every write asks first. Your credentials never leave your Mac.

  • 7-day free trial
  • macOS · Apple silicon and Intel

ARNscope is still in beta: expect frequent updates until it’s stable.

A Step Functions execution, live: graph, timings, per-state input and logs.Sample data from a fictional account

Watch the 80-second tour.

A Step Functions run, an ECS rollout, CloudWatch Logs, the RDS console and Valkey, then split view, menu-bar tunnels and the check before a write. Narrated, with captions.

Plays on YouTube, with captions. Nothing loads from YouTube until you press play.Sample data from a fictional account

The console is free. Your time isn’t.

On a yearly plan ARNscope costs less than $1 a week. If it saves you ten minutes a week, it has paid for itself many times over. These are the minutes it saves.

  • Query a private database

    The console’s query editor covers Aurora with the Data API. For anything else you open a terminal, start a bastion session with the Session Manager plugin, then run psql. ARNscope opens the SSM tunnel through your bastion itself and gives you a SQL console.

  • Find what broke in a Step Functions run

    The console shows the failed state, but its log lines are in CloudWatch, in a stream you have to find. In ARNscope the state’s input, output and logs sit together, and keep tailing while the run goes on.

  • See every alarm that’s firing

    The console lists alarms one account and region at a time. ARNscope shows what’s firing across your profiles and regions, and can notify you on your Mac.

  • Look around without fear

    Browsing is read-only. Every write, from stopping an instance to editing a cache value, asks you to confirm first.

Seventeen services, one rail.

The same service rail you get in the app, grouped the way you work. Every page keeps your profile and region in the title bar, so you always know which account you’re looking at.

Observe

  • Alarms

    States and history, plus an optional Mac notification when one fires.

  • CloudWatch

    Open your dashboards, or build one from any metric.

  • Logs

    Every log group: search, Live Tail, Insights when you ask, and favourite queries and filters.

Compute

  • Lambda

    Log streams, Logs Insights search, Live Tail and invoke.

  • ECS

    Rollouts, tasks, task definitions, logs and a network map.

  • EC2

    Instances, status checks, metrics and Session Manager in your terminal.

  • Step Functions

    Live execution graph with each state’s input, output and logs.

Data

  • RDS

    PostgreSQL console with IAM auth, EXPLAIN plans and Top SQL.

  • DynamoDB

    Get, query and scan items into a typed grid.

  • SQS

    Depth and settings; messages are received only when you ask.

  • MSK

    Topics, consumer-group lag and messages, read-only over IAM through a tunnel.

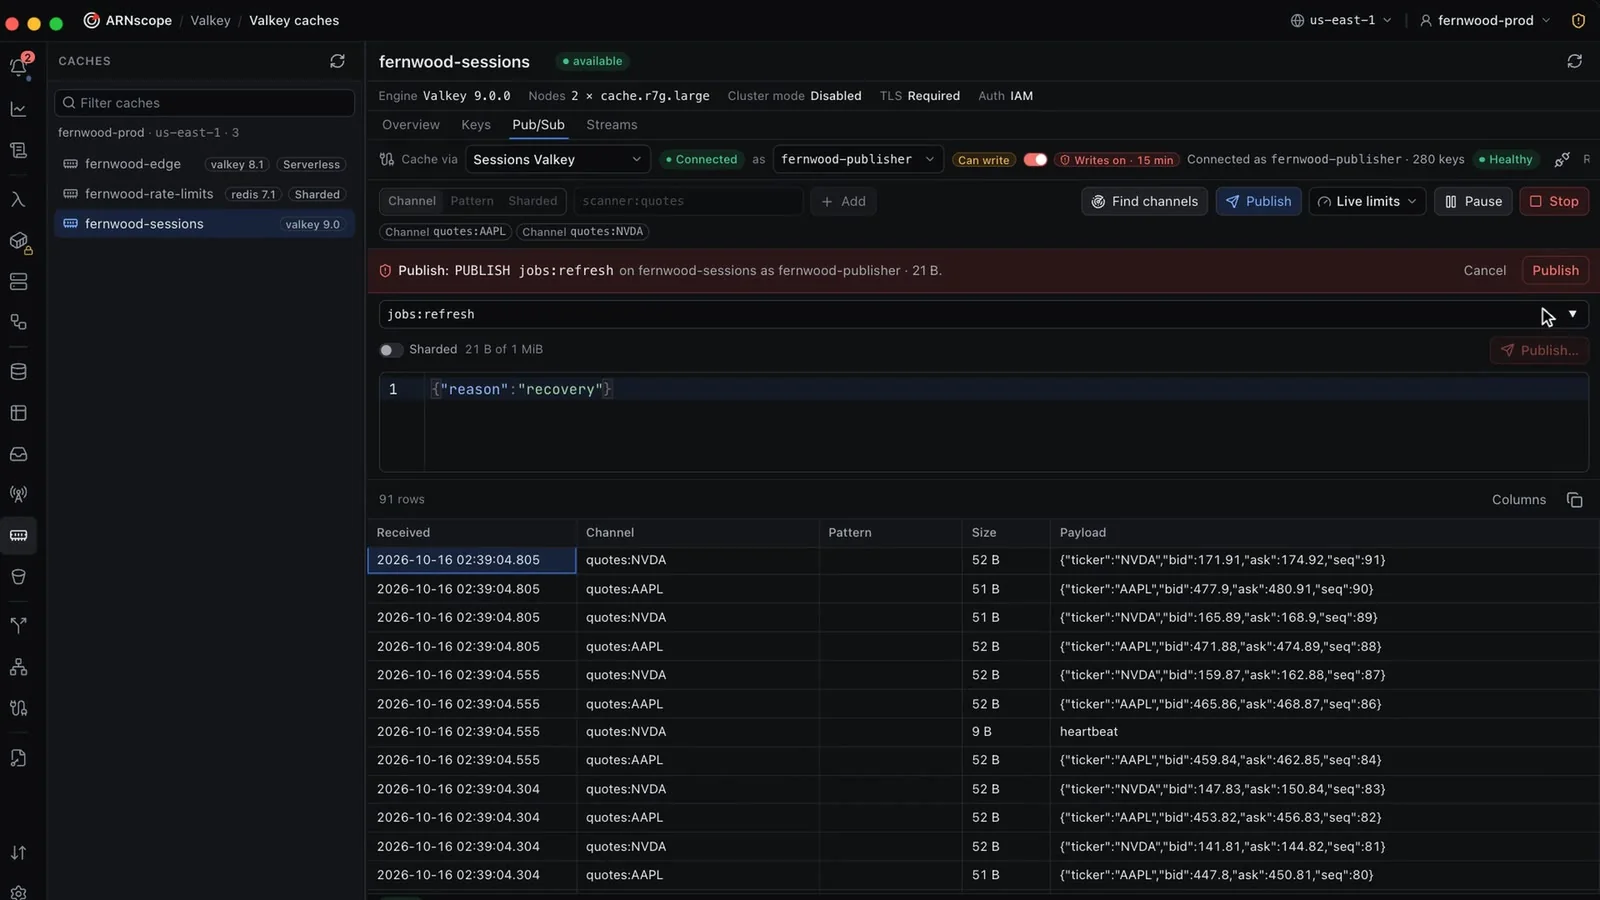
  • Valkey

    Keys, Pub/Sub and streams; read by default, writes behind a danger zone.

  • S3

    Browse, preview and edit; open Parquet in place.

Network

  • ALB logs

    Traffic, errors and latency by route, host and target, from access logs in S3.

  • VPC Flow

    Who talks to whom, what reaches the internet and what was blocked.

  • Tunnels

    Reach private databases, Kafka and caches through a bastion over SSM, without the AWS CLI.

Security

  • Secrets

    Edit KMS-encrypted SOPS files in S3 without writing plaintext to disk.

Deeper than a list of resources.

In each workspace, the logs, metrics and actions you’d otherwise hunt for across four console tabs sit next to the thing they belong to.

Step Functions

Watch an execution move, state by state.

The graph fills in while the execution runs. Select any state to see its input, output, definition and the log lines it wrote — no digging for the right CloudWatch stream.

  • Live graph with durations, retries and the slowest state
  • Per-state logs that keep tailing while the execution runs
  • Timeline and event history; start executions with JSON input
Execution graph and per-state logs.Sample data
ECS and split view

Follow a rollout, then put two services side by side.

See each deployment land task by task, with CPU, memory and service events beside it. Drag a second service into split view to compare configuration, metrics or logs without losing your place.

  • Rollout progress for every active deployment
  • Edit a task definition and review the diff before you deploy
  • Split view for any two resources of the same type
A rollout in progress, then split view.Sample data
S3

Open Parquet and images where they live.

Preview objects without downloading them first. Images render, JSON and code get syntax colors, and Parquet opens as a table you can filter. Edit a text file and save it straight back to the bucket.

  • Parquet as a filterable table, read in place
  • Upload, copy, move and rename
  • Share links with an expiry, storage analytics and an activity log
Parquet and image previews in an S3 bucket.Sample data
Lambda

Lambda logs, as they happen.

Read recent log streams, search them with ready-made Logs Insights filters for errors, timeouts and cold starts, or start Live Tail and invoke the function to watch its logs arrive.

  • Live Tail, then invoke with a payload and watch the logs arrive
  • One-click searches: errors, timeouts, cold starts, out-of-memory
  • Invocation and duration metrics next to the logs
Live Tail while invoking a function.Sample data
RDS and Aurora PostgreSQL

A SQL console with Top SQL beside it.

Connect with IAM authentication through a local tunnel — no database passwords to store. Run queries with history and drafts, read EXPLAIN plans as a tree, and find the statements costing you most.

  • Schema browser and an editor that knows your tables
  • Top SQL from pg_stat_statements and Performance Insights
  • Instance metrics on the same page
The SQL console and Top SQL.Sample data
Kafka on MSK

Read the messages on a topic, without a Kafka client.

Topics, partitions and offsets come straight from the MSK API. Start a tunnel through your own bastion and ARNscope reads the brokers over IAM: the latest messages, consumer-group lag and a live tail. It never produces, deletes or commits offsets.

  • Partitions, offsets and message counts per topic
  • Messages pretty-printed as JSON, filtered by key, value or headers
  • Consumer-group lag and live tail, strictly read-only
Topics, then the latest messages and a filter.Sample data
CloudWatch

Your dashboards and alarms, a click from the resource.

Open the dashboards your account already has, or build one from any metric it reports. Alarms show their state and history, and ARNscope can notify you when one fires — only if you turn that on.

  • Existing dashboards, plus your own from any metric
  • Alarm state, history and the metric behind it
  • Opt-in Mac notifications; turned off, nothing is polled
Dashboards and alarms.Sample data

Nothing sits between you and AWS.

ARNscope signs requests on your Mac with the profiles you already use and calls AWS directly. There is no ARNscope account, no backend to route through, and no telemetry.

  • Your profiles, your SSO

    ARNscope reads the profiles in ~/.aws, including IAM Identity Center sign-ins, and asks AWS for exactly what you open. It keeps no access keys of its own.

  • No saved database passwords

    RDS, MSK and Valkey connections use short-lived IAM authentication where they can. When a database needs a password, ARNscope reads it from Secrets Manager as you connect, or you type it, and it is never saved.

  • No telemetry, no analytics

    The app has no usage tracking, analytics or crash reporting. Your activity history stays in a local database on your Mac.

  • Quiet by default

    Collapsed panels don’t fetch, billed queries like Logs Insights run only when you ask, and background checks happen only for alarm notifications you switch on.

Try it free. Then pay monthly or save with a year.

Every plan is the full app with a free trial. Checkout is handled by Polar. Your license key arrives by email straight after, and works on up to 3 Macs.

Monthly

$7per month

Pay as you go. Cancel any time.

Start monthly trial

Yearly Save 42%

$84$49per year

About $4 a month. Five months free compared with monthly.

  • Every service and feature
  • 7 days free, then billed once a year
  • Support at [email protected]
Start yearly trial

Prices in US dollars; tax is added at checkout where it applies. Download the app first if you like: it asks for the key when it opens. Questions about team or volume licenses? [email protected]

Questions

Something not covered here? Write to [email protected].

Which Macs does it run on?

Apple silicon and Intel Macs, each with its own download on the download page.

Is there a Windows or Linux version?

Not today. ARNscope is built and tested on macOS. If you need another platform, tell us at [email protected].

How does it sign in to AWS?

With the profiles you already have in ~/.aws, including IAM Identity Center (SSO). Pick a profile and a region in the title bar; every request is signed on your Mac and sent straight to AWS.

What permissions does it need?

Only what your profile already has. ARNscope calls the same AWS APIs the console does, as you. A read-only role is enough for browsing; actions like deploying a service or stopping an instance need the matching permissions.

Will it add to my AWS bill?

Some AWS APIs are billed, such as CloudWatch Logs Insights queries and metric reads. ARNscope doesn’t poll in the background unless you turn on alarm notifications, and billed scans start only when you ask for them.

Does ARNscope collect any data?

No. There is no telemetry, analytics or crash reporting, and no ARNscope account. Apart from AWS, the app contacts one host: updates.arnscope.com, to check for signed updates.

How do updates work?

ARNscope checks for a new version when it starts and tells you when one is ready. Updates are signed, and they install when you choose to.

How does the free trial work?

Every plan starts with a 7-day trial. You get a license key straight away and the full app. Cancel before the trial ends and you aren’t charged; otherwise the plan continues at its price.

Is it still in beta?

Yes. Everything on this page works today, but updates come often until ARNscope is stable. Found a bug? Use Report a problem in Settings, or write to [email protected].

Close a few console tabs.